
The March 2026 Consumer Price Index came in hotter than expected on the headline measure, with prices rising 0.9% against a 0.7% consensus forecast. Energy costs drove the beat, rising 12.5% year-over-year as the Iran war and Strait of Hormuz blockade kept global oil supply constrained even as a ceasefire came into effect. Core CPI, which strips out food and energy, rose just 0.2% - below the 0.3% consensus - leaving the Federal Reserve with a split inflation picture.
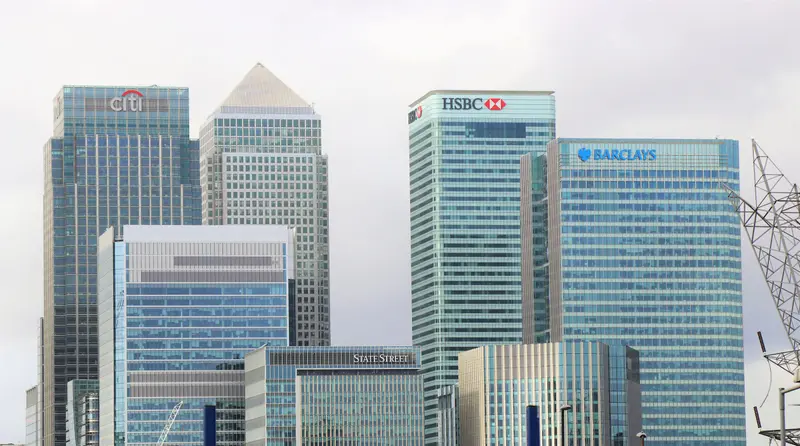
The US Bureau of Labor Statistics reported March 2026 headline Consumer Price Index growth of 0.9% - beating the 0.7% consensus and marking the largest single-month increase since the energy shock of early 2022. Energy accounted for nearly all of the beat, rising 12.5% year-over-year as the Iran war and Strait of Hormuz blockade kept global oil markets in a supply shock. Core CPI - which excludes food and energy - rose a below-consensus 0.2%.
The Energy Factor
The split between headline and core CPI reflects a well-established pattern in energy-driven inflation episodes: energy prices spike first, core prices follow with a lag. The national average for regular gasoline crossed $4 per gallon in late March, the first time that threshold has been breached since August 2022. Diesel topped $5.45 per gallon. Brent crude briefly exceeded $102 per barrel before the US-Iran ceasefire was agreed on April 8.
With the ceasefire now in effect and US and Iranian delegations in Islamabad for peace talks, commodity analysts have begun revising forecasts downward. Brent crude is now projected to average $58 per barrel for full-year 2026. However, energy-intensive AI data center construction and manufacturing reshoring are adding structural demand that will limit how far prices fall even as the war premium deflates.
Gold and Safe-Haven Demand
Gold has been one of the standout performers of 2026. Global spot gold prices are tracking toward the $4,753 per ounce annual average forecast, up from roughly $2,600 at the start of the year. In Pakistan, gold per tola hit Rs 497,662 on April 11 - a surge of Rs 3,000 in a single day - driven by safe-haven demand from both the war premium and currency depreciation pressures visible across emerging markets.
Silver is also elevated, with 2026 forecasts pointing toward $56 per ounce. The combination of inflation, geopolitical risk, and tariff uncertainty has revived the classic flight-to-safety trade. Technology and AI infrastructure has been the other major safe-harbor asset class, with AI-related stocks outperforming the broader S&P 500 throughout the volatility.
Market Reaction
US equities closed mixed on the April 11 CPI data. The S&P 500 ended at 6,816.89, down 0.11%. The Dow fell 0.56% as energy sector volatility weighed on the index. The Nasdaq edged up 0.35%, supported by continued inflows into technology. Bond markets tightened slightly as traders reassessed Fed rate cut timing in light of the headline CPI beat.
The Federal Reserve held rates steady through all of Q1 2026. With core CPI printing below expectations and headline inflation clearly driven by a transitory energy shock now beginning to ease, the probability of a rate cut before year-end edged higher in interest rate futures after the data release. Goldman Sachs, which reports Q1 earnings on April 13, is expected to benefit from both the M&A boom and stable high rates on its lending book.
Tariff Inflation Still Incoming
The energy picture is improving but tariff-driven inflation is building in the pipeline. Economists estimate a 12 to 18-month lag before tariff costs reach consumer prices. The 10% blanket tariff imposed under Section 122 authority adds an estimated $600 per household in annualized costs. A new 100% tariff on patented pharmaceutical imports under Section 232, announced in early April, will add further pressure in the healthcare sector in the second half of 2026.
The Federal Reserve faces a data environment where headline and core signals are pointing in opposite directions - energy deflating, tariffs building. That is precisely why bank earnings calls this week are being watched so closely for CEO-level reads on the economic outlook.
Source: Charles Schwab Market Update · Yahoo Finance · Yale Budget Lab

Frequently Asked Questions
What drove the March 2026 CPI beat?
Energy prices were the primary driver, rising 12.5% year-over-year. The Iran war and Strait of Hormuz blockade that began in late February 2026 pushed oil prices sharply higher. The national average for gasoline crossed $4 per gallon in late March. Energy is a volatile CPI component - the Fed typically looks past single-month energy spikes when setting policy.
What does core CPI at 0.2% mean for the Fed?
Core CPI below consensus gives the Federal Reserve room to hold rates steady without escalating. The Fed maintained rates throughout Q1 2026, and the soft core reading reduces urgency to hike further. However, a sustained energy shock eventually bleeds into core prices through transportation and manufacturing costs, which is why analysts say the current read is a temporary reprieve rather than an all-clear.
How is gold performing amid current inflation?
Gold has risen sharply in 2026. In Pakistan, the price per tola hit Rs 497,662 on April 11 - a single-day surge of Rs 3,000. Global gold prices are tracking toward the $4,753 per ounce average forecast for 2026. Safe-haven demand driven by the Iran war, tariff uncertainty, and inflation concerns has made gold one of the strongest-performing assets of the year alongside AI infrastructure stocks.
What are commodity price forecasts for the rest of 2026?
With the US-Iran ceasefire now in effect, Brent crude is forecast to average $58 per barrel for 2026 - down sharply from the $100+ peak reached in March. Natural gas is expected at 28.75 EUR/MWh. Gold remains elevated at a projected $4,753 per ounce average. Silver is forecast at $56 per ounce. The ceasefire has introduced downward pressure on energy but the Strait of Hormuz shipping backlog means full relief is still weeks away.
How do Trump tariffs factor into the inflation picture?
Economists estimate a lag of 12 to 18 months before tariff effects reach consumers, placing peak tariff-driven inflation pressure between April and October 2026. The 10% blanket tariff under Section 122 authority - the replacement for IEEPA tariffs struck down by the Supreme Court in February - adds an estimated $600 per household in annual costs. A new 100% tariff on patented pharmaceutical imports under Section 232 could add further pressure to healthcare costs in the second half of 2026.
The Bottom Line
Continue reading related coverage in News or browse the latest articles.